The European retail estate is about to operate the largest in-store product take-back programme in the region's history. Textiles is the leading public case, with the EU directive operational by 2028. Batteries are operational ahead of it. Small WEEE has been a retailer obligation for thirteen years. The constraint on what these programmes achieve is not the collection infrastructure; it is the engagement-and-incentivisation layer at the moment of consumer return. This is where we sit, and this is what we measure.
In 2016, the EU separately collected 10.7% of its textile waste. By 2022 the figure was 15.0%. The trajectory is positive. It is also, at 0.72 percentage points per year, slow.
Project that line forward at its current pace. The EU's 2030 collection ambition of 50% is reached around 2071. The 2030 upside of 80% is reached around 2113. (Source: EEA Briefing 03/2024; calculation in the textile research paper.)
European textile waste runs to 6.94 million tonnes a year, sixteen kilogrammes per person. Around 85% of post-consumer textile waste goes straight to mixed household waste. The remaining 15% enters the collection system, where roughly two-thirds is lost again to sorting and processing yield.
A great deal is wrong with that picture. Most of it is downstream of the same root cause: the moment a consumer decides to bring a product back is the moment the entire system needs to know what the product is, who is returning it, and where it should go next. Today, almost none of that information is captured.
There is a distinction worth naming up front. Yield-side sustainability, whether the existing flow of product is recovered, sorted, and reprocessed at higher rates, is what the current trajectory measures. Volume-side sustainability, whether the volume of product placed on market is compatible with the system's capacity to process it, is the harder question that the directive's eco-modulation clause begins to operationalise. Yield-side sustainability is necessary but not sufficient; volume-side sustainability is the harder question.
Directive (EU) 2025/1892 places the textile EPR obligation on the entity placing goods on the EU market under its own name, brand, or trademark, and eco-modulates the fees against durability, reparability, and recyclability: a design that only operates when the obligated party is also the design-controlling party. The directive sets the floor; whether the operational layer behind it gets built depends on whether the industry reads retailers as operators or as a financing line.
The constraint is not collection infrastructure. It is the engagement-and-incentivisation layer at the moment of consumer return.
Utilitarian operates at the moment of consumer return. That moment is the only physical location in the system at which the data needed by every downstream actor (the recycler, the regulator, the brand, the consumer) is naturally co-located with the consumer whose action makes it accessible.
Under the EU Categorisation System for the Circular Economy, the platform sits in two adjacent positions. Category 3, sub-category Traceability platforms. Category 4, Enabling Technologies. The first describes what the platform does. The second describes how it scales.
Impact metrics are reported in priority order of operational verifiability, not in order of marketing weight. The strongest-verifiable, most-defensible indicator is reported first. The indicators that depend on a displacement factor the platform is itself the instrument for measuring are reported second tier, with the dependency named.
| # | Indicator | Framework category | Verifiability today |
|---|---|---|---|
| 1 | Waste diverted from disposal (kg) | EU Cat 3, Performance Indicator | Strong (direct measurement) |
| 2 | Verified consumer engagement (emails captured, repeat rate) | Performance + economic value | Strong (direct measurement) |
| 3 | Per-product end-of-life events captured (brand-attributed) | Compliance evidence | Strong (direct measurement) |
| 4 | Linear resource use avoided (tonnes) | GCP-aligned, Headline Indicator | Partial (mass × displacement factor) |
| 5 | GHG emissions avoided (tCO2e) | GCP-aligned, Impact Indicator | Partial (mass × pathway × displacement factor) |
| 6 | Additional indicators (water, hazardous waste, non-GHG pollutants) | Sector-level conversion factors | Partial (BCG/ReHubs conversion rates) |
The first three are operationally measured at the scan event. The next two depend on a displacement factor that the platform is itself the research instrument for measuring at retail scale (the white paper develops this in full). The sixth is calculable from published sector conversion rates. The ordering is deliberate. The reader's eye lands on the strongest, most-defensible metric first.
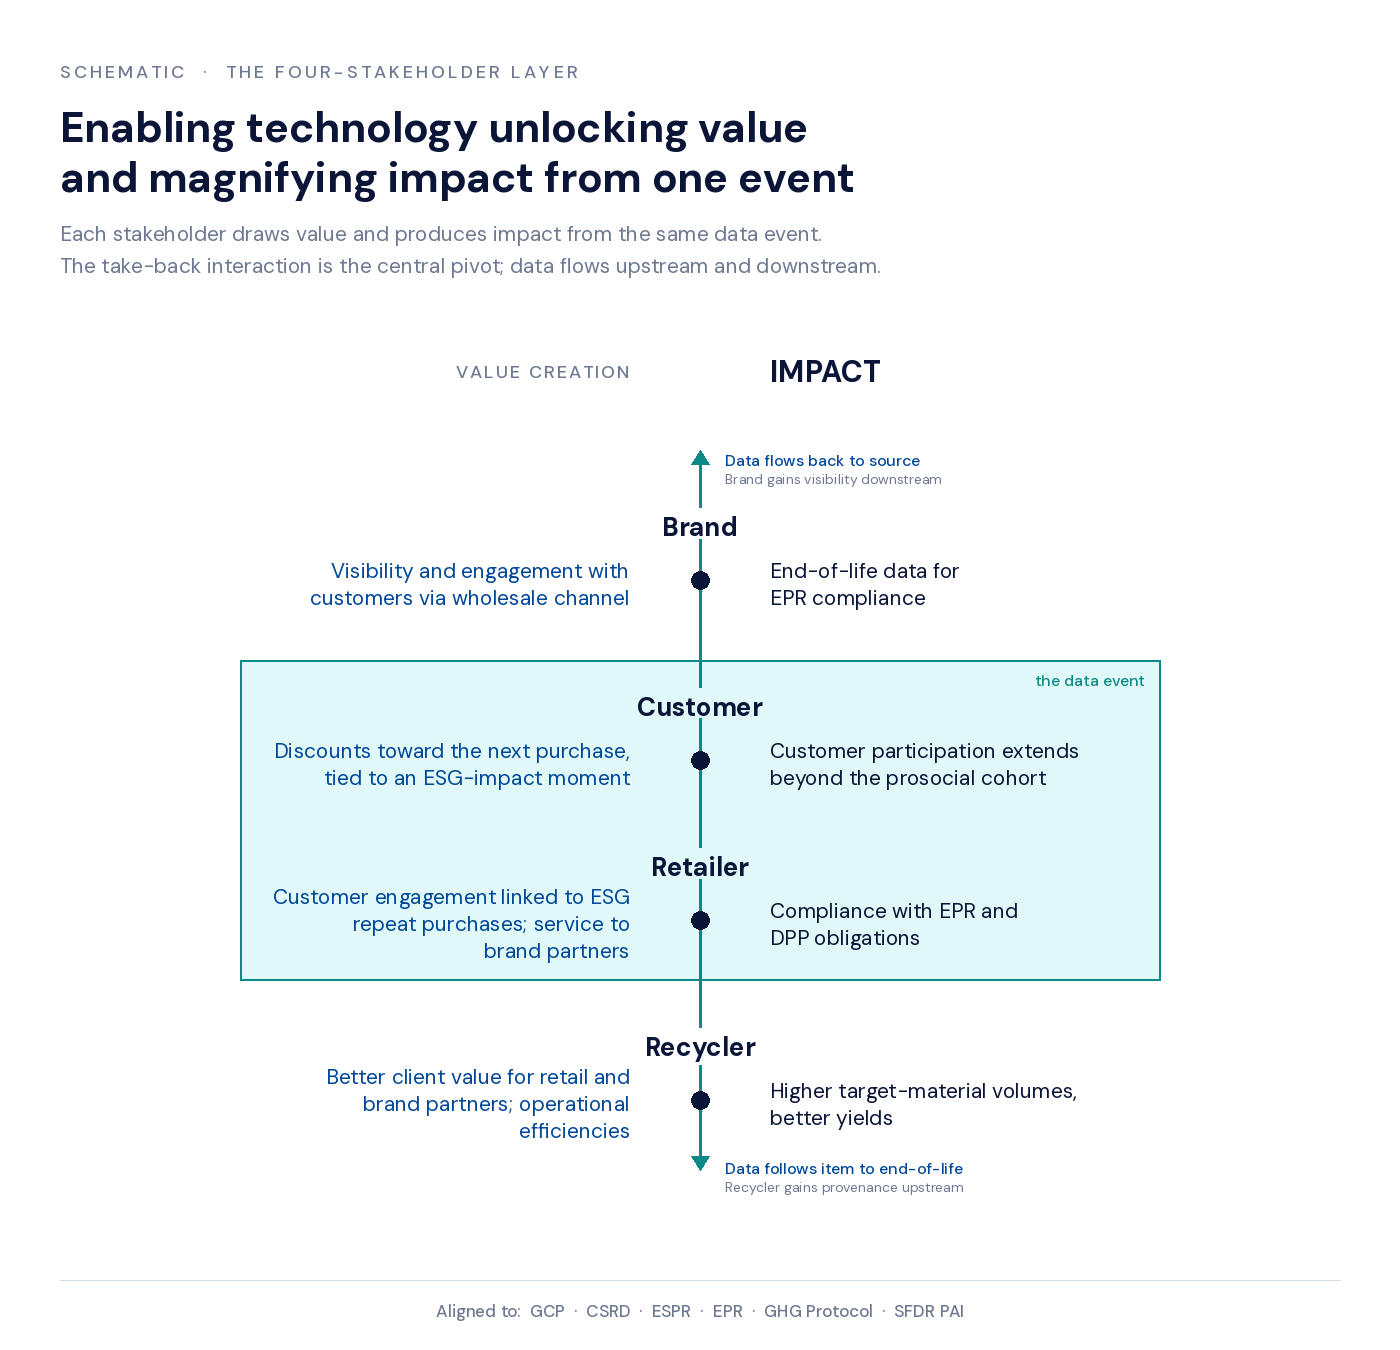
The four-stakeholder framing is the structural spine of the impact thesis. Every node in the value chain captures both a commercial value and a sustainability impact from the same data event. Without the commercial value, the sustainability impact is a cost line a finance director will pressure-test out of the budget. Without the sustainability impact, the commercial value is a transaction with no claim on the regulator's frameworks. The two channels travel together, or they do not travel.
The behavioural literature is clear on why this matters. Cohort research finds three groups in roughly stable ratios: a prosocial baseline of around 18%, a middle cohort of around 50% that participates when participation is easy and visible, and an indifferent cohort of around 32% that does not participate at all (EEA 2024 Briefing 03/2024; replicated in the textile research paper). The existing batch-collection model (drop the bag at the door, take it to a charity bin, accumulate enough to make the trip worthwhile) serves the prosocial baseline well, the middle cohort only when the trip is convenient, and the indifferent cohort not at all. A drip-style take-back at the moment of replacement purchase converts the consumer ask from "accumulate then dispose" to "bring it back when you next come in." Different cognitive load. Different participation curve.
The retailer's resistance to accommodating take-back has been read in the industry as a sustainability-attitude problem. The evidence describes a binding-constraint problem. The European apparel and footwear store is engineered to convert square metres into transactions at a defined gross-margin yield against a labour budget set by sales forecast. Read as an operating system, it exposes four binding constraints: thin operating margin (3.7 to 6.5 per cent at the apparel composite, Inditex aside (Deloitte 2024)); a fully allocated labour envelope (65 to 75 per cent of associate time committed to scheduled tasks (NRF Foundation 2022)); footprint priced at €4,000 to €20,000 per square metre per year on prime European high streets (Cushman & Wakefield 2024); and working capital disciplined by inventory turn of 3.2 to 4.4 times. Conventional take-back, with back-of-house bins, manual sorting, weight-based reporting, and parallel reverse logistics, violates each input simultaneously.
The test any take-back model must pass to deploy at retail scale follows from the constraints, not from an external standard: no unscheduled associate time at till or fitting room, no back-of-house footprint at sales-productivity rates, no non-sellable inventory on the retailer's balance sheet, no single-processor dependency for continuity of operation. The SOEX/I:CO insolvency of October 2024 is the proximate illustration of the fourth condition failing across H&M's pan-European programme (Sourcing Journal 2024).
A take-back model that satisfies all four conditions and produces a verified email plus an in-store visit plus a structured replacement-consideration window per scan is not a compliance cost line. It is the cheapest verified email a physical retailer can buy, and the cost is already provisioned in the EPR and CSRD budgets. The order matters. The operating-system test comes first; the cost-line conversion follows from passing it.
The 6 to 46 per cent transparency-premium figure is drawn from Buell & Kalkanci 2021, Management Science.
The wholesale-channel data gap is the largest single visibility problem for a brand with multi-channel distribution. The direct-to-consumer channel returns product-level data by default. The wholesale channel returns weight reports. CSRD does not accept weight reports as evidence for product-level reporting obligations. The data layer at the take-back counter is the only point in the wholesale chain where the brand can attach an identifier to a returned product without owning the retail relationship.
The European materials recovery facility for textiles costs €15 million to €40 million per build, with cumulative European investment requirements estimated at €6 to €7 billion by 2030 (BCG/ReHubs 2026). The 36 per cent communal sort yield benchmark is not a fact about textile waste; it is a fact about textile waste without identification at the point of return. The capex is, structurally, the price paid downstream for not knowing upstream. European textile-to-textile recycling margins for polyester recyclers run from minus 75 per cent to minus 25 per cent. Renewcell raised over €200 million against a working chemical recycling process and went bankrupt in February 2024 on a feedstock failure. The technology was not the bottleneck. The technology in front of the sorting facility was.
Identification at the moment of return is a candidate for reallocating the MRF capex, not for adding to it.
The full development sits in the white paper. The eight-step structure here gives the reader the shape of the causal chain and the published literature each step rests on. Every link is operationally measured today or is named as an open empirical question in §9 below.
Consumer participation in textile take-back is not uniform. Behavioural cohort research identifies three groups in stable ratios: a prosocial baseline of around 18 per cent who participate without prompting, a middle cohort of around 50 per cent who participate when the action is easy and visible, and an indifferent cohort of around 32 per cent who do not participate at all. The existing batch-collection model captures the prosocial baseline. Retail take-back at the moment of replacement purchase is the only mechanic that converts the middle cohort. EEA 2024 published the cohort breakdown; the textile research paper replicates it operationally. See white paper §6 Link 1 for the full development.
Conventional take-back assumes the customer accumulates items at home and makes a dedicated trip to a collection point. The retail take-back model uses a different mechanic: the customer brings a single item back at the moment of their next replacement-purchase trip, rather than when the accumulated load justifies a separate trip. The behavioural literature identifies information, rewards, and convenience as the three levers that recruit participation beyond the prosocial baseline; the drip model pulls all three at once. Returns research from McKie, Sáez de Tejada Cuenca and Agrawal (2025) in M&SOM and transparency research from Buell and Kalkanci (2021) in Management Science develop the underlying mechanics. See white paper §6 Link 2 for the full development.
Store-level scan rates vary substantially. The pilot data, reported in the impact thesis, shows three of nine stores accounting for around 86 per cent of total scans, and not all three are flagship locations. Four observable factors drive the variance: how the in-store reward is structured, how prominently the QR code is positioned at the take-back counter, how engaged frontline staff are with the customer interaction, and the mix of brands the store carries. The brand-mix hypothesis (that captured product mix reflects existing market share rather than platform bias) is testable at retail scale and is currently an open research question. See white paper §6 Link 3 for the full development.
Customer participation responds to rewards on a non-linear curve. A small reward lifts participation above the baseline. A larger reward continues to lift participation up to a point. Beyond that point, the crowding-out zone, the intrinsic motivation that drove participation in the first place is undermined, and participation drops back. Reward design is therefore not about maximising the reward but about finding the inflection point on the curve. Behavioural research from Wollbrant, Knutsson and Martinsson (2022) in Nature Human Behaviour develops the underlying crowding-out mechanism. See white paper §6 Link 4 for the full development.
Communal collection bundles textiles without identification. Sorters extract value from unidentified mixed material at the back end, and four failure modes follow: contamination from non-textile items, mixed-fibre bundling that complicates recycling, lost product attribution that prevents brand-level reporting, and condition-grade variability that pushes margin onto the sorter. At the retail take-back counter, the customer identifies the product at the point of return; all four failure modes are structurally absent. The 36 per cent communal sort yield reported in BCG/ReHubs 2026 and the broader material-impact framing in Niinimäki et al. 2020 in Nature Reviews Earth & Environment both treat pre-sort information absence as a structural rather than physical constraint. See white paper §6 Link 5 for the full development.
Industrial-scale fibre-to-fibre recycling depends on consistent, characterised feedstock. Current European materials recovery facility capex, estimated at €8 to €11 billion across the build-out, exists to extract characterised feedstock from unsorted material at the recycler end. Identification at the moment of return delivers the same outcome at a fraction of the cost. European fibre-to-fibre recycling margins for polyester recyclers run from minus 75 to minus 25 per cent per tonne. The unviability is a feedstock problem, not a technology problem. Renewcell's 2024 bankruptcy illustrates the downstream consequence: €200 million of capital deployed against a working chemical process the feedstock specification could not service (Fashion Dive 2024). See white paper §6 Link 6 for the full development.
Diverted material is not equivalent to avoided emissions. The conversion runs through three multipliers: sort yield (how much of the diverted material enters next-generation recycling), pathway-specific lifecycle CO2e (the emission profile of the recovered-fibre product versus its virgin equivalent), and displacement factor (the share of recovered material that genuinely substitutes for new production rather than adding to total consumption). The displacement factor is the single largest sensitivity in the model; the central estimate of 0.65 sits inside a 0.5 to 0.9 range from the rebound-effects literature (Wiedmann et al. 2019; Sandin and Peters 2018). See white paper §9 for the cohort-stratified arithmetic.
Retailer engagement with the platform compounds through a deployment-quality flywheel. Higher engagement produces better deployment quality (QR placement, frontline staff training, reward structure). Better deployment produces better data (more scans, cleaner product identification, sharper brand-mix signal). Better data produces better commercial outcomes for the retailer: the pilot deployment shows €2.72 cost per email captured, around 27 per cent of email-captured scans from repeat customers, and observable brand-mix variance that the marketing team can act on. Better commercial outcomes pull more retailer investment in deployment quality, and the loop closes. See white paper §6 Link 8 for the full development.
The full chain (relationship, current operational measurement, peer-reviewed anchor, and remaining open question) is developed in The Impact Thesis.
The Waste Framework Directive amendment (Directive (EU) 2025/1892) brings every large-format apparel, footwear, and sportswear retailer in the EU27 and EEA under an EPR obligation for textiles by 17 April 2028. The cohort-stratified European retail estate is approximately 173,500 stores across four operationally distinct cohorts: ~12,000 major chain stores (Cohort A), ~40,000 mid-tier and franchise chain stores (Cohort B), ~120,000 independent specialty stores (Cohort C), and ~1,500 department-store and multi-category retail formats (Cohort D). Each will operate an in-store collection programme. Today, almost none of those programmes produce structured per-product data from a single return event.
European textile waste runs to approximately 7.2 million tonnes a year. At the cohort-stratified central scenario, the platform diverts approximately 390,000 tonnes from disposal: approximately 5.4 per cent of total flow. Read against the trajectory denominator (the gap between the current 14.7 per cent collection rate and the 50 per cent ambition the EU has set for 2030), the contribution is approximately 15 per cent of the gap. Operating alongside continued growth in municipal, charity, and online collection channels, retail take-back at cohort-stratified scale is the first measurable contribution to closing the gap, and the only contribution that produces per-event evidence across all four converging frameworks at SKU resolution. The arithmetic is linear in the per-store weighted average, the assumptions are documented in the white paper, and the slider above lets the reader pressure-test the result against alternative deployment assumptions.
The platform's impact attribution maps simultaneously against every framework an informed impact investor will already recognise. Universally accepted, internationally recognised. No fund-specific protocols. The frameworks above the disclosure floor are complemented by the operational mechanisms a CFO already uses: Environmental P&L modelling, internal carbon pricing, sustainability-adjusted hurdle rates, sustainability-linked finance. Each runs on the same per-event SKU-resolution substrate the platform produces.
Brands that frame EPR as cost will pay it; brands that frame it as infrastructure will recoup it as marketing budget and risk reduction.
The full framework crosswalk and the operational mechanisms reading (each framework, what alignment specifically means, and what evidence the platform produces, plus the CFO-side mechanisms developed in §10) are set out in The Impact Thesis.
Textiles is the worked example; the structural argument extends across the consumer product categories where producer responsibility plus retailer obligation is the legislative pattern. The same data event that satisfies textile EPR and CSRD reporting also serves portable batteries (operational under Regulation (EU) 2023/1542 ahead of textiles, with a 73 per cent collection-rate target by 2030), small waste electrical and electronic equipment (the cautionary case: thirteen years of retailer obligation, 40.6 per cent collection against a 65 per cent target, gap widening rather than closing), and the emerging Ecodesign for Sustainable Products Regulation delegated-act categories on a 2026 to 2028 horizon.
Two impact vectors become structurally visible at this scope. Fire-safe routing for lithium-ion-containing categories. Aggregate UK lithium-ion-attributed waste-sector fire losses are estimated at £158 million per year, with the £27 million Aberdeen MRF fire in October 2024 the most documented single-event loss. Per-product identification at the point of return is the operational mechanism that routes these items to fire-safe processing. Per-SKU eco-modulation at product-design resolution. The eco-modulation signal reaches back into product specification only when the obligated party knows what was returned at SKU resolution. Without that record, eco-modulation defaults to category averages, and the design-incentive feedback loop the directive's choice of obligated party was constructed to produce does not operate as designed.
Where the argument is strongest, where it is weakest, and the boundary of the claim are set out in the white paper at §13.
Four empirical questions remain open at the time of publication. Each is the platform's own research output over the next twenty-four months, in partnership with downstream operators and the academic literature. They are listed here because the credibility of every other claim in this thesis depends on them being named in plain sight, not buried.
The binding parameter for net environmental benefit. Measurable only through downstream lifecycle assessment against deployment data the platform itself produces. (Wiedmann et al. 2019 and the rebound-effects literature.)
What it takes to recruit participation beyond the prosocial baseline. Measurable through deployment variance and the incentive-design research already in flight.
Including the brand-mix hypothesis (that captured product mix reflects existing market share rather than platform bias). Testable at scale, not at a single deployment.
The expected sort-yield improvement from identified versus communal feedstock. Measurable through downstream-partner lifecycle assessment.
A formal third-party lifecycle assessment is not yet complete. The platform produces the deployment data (scan event, product attribution, condition grade, downstream pathway) that an LCA practitioner needs as input. The first formal LCA is scoped for completion in 2026, with the downstream recycler partner. The white paper documents the pending status alongside every claim that depends on it.
Honestly. The displacement factor is the platform's largest open empirical question. The white paper presents the central estimate, the range, and the methodology under which the platform itself is the research instrument for narrowing the range. No claim that depends on the displacement factor is presented without the dependency being named in line.
The platform is operating across multiple retail stores in the Netherlands with INTERSPORT, Runnersworld, and EK Sport, plus the recycler partner FastFeetGrinded. The empirical findings reported in the textile research paper are drawn from this deployment.
1,556 scans, 1,398 emails captured at a 90 per cent capture rate, 92 per cent AI product-identification accuracy, across August 2025 through 9 May 2026. Approximately 1.5 items per identified customer over nine months. Approximately 27 per cent of email-captured scans from repeat customers. €2.72 cost per email captured.
In initiation phase. Not certified. The white paper documents the certification roadmap alongside the data-handling architecture currently in production.
The white paper is the long-form treatment of every argument on this page, with the full citations and the methodology behind the impact arithmetic.